
Java RAM Usage in Containers: Top 5 Tips Not to Lose Your Memory
In this article, we would like to share specifics of Java memory management and elasticity inside containers that are not evident at the first sight. Below you’ll find a list of the issues to be aware of and important updates in the upcoming JDK releases, as well as existing workarounds for the core pain points. We collected the top 5 most interesting and useful tips to improve resource usage efficiency for Java applications.
Java Heap Memory Limit in Docker
Currently, the community is discussing questions about incorrect memory limits determination while running Java applications in Docker Containers.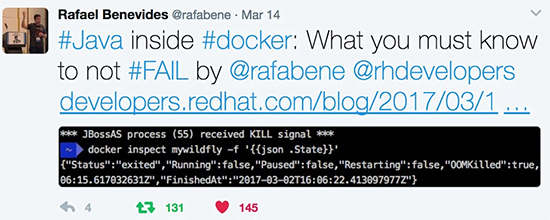
The issue is that if Xmx option is not defined explicitly, then JVM uses 1/4th of all memory available for the host OS due to a default internal garbage collection (GC) ergonomic algorithm. This can lead to killing the Java process by the kernel if JVM memory usage grows over the cgroups limit defined for a Docker container.
To solve this problem, one improvement was recently implemented in OpenJDK 9:
A new JVM option (-XX:+UseCGroupMemoryLimitForHeap) automatically sets Xmx for a Java process according to memory limit defined in cgroup.
As a good workaround to solve the issue before public Java 9 release, Xmx limit can be specified explicitly in startup options for JVM. There is an open pull request for “a script to set better default Xmx values according to the docker memory limits” in the official OpenJDK repo.
Jelastic managed to omit incorrect memory limit determination by using an enhanced system containers virtualization layer in combination with Docker images. Earlier we explained how it works in the article Java and Memory Limits in Containers: LXC, Docker and OpenVZ.
Tracking Native Non-Heap Memory Usage
While running Java applications in the cloud it’s also important to pay attention to the native memory usage by Java process, so-called off-heap memory. It can be consumed for different purposes:
- Garbage Collectors and JIT optimizations are tracking and storing data of the object graphs in the native memory. Moreover, since JDK8, names and fields of classes, bytecode of the methods, constant pool, etc are now located in Metaspace which is also stored outside of JVM heap.
- Also, to gain high performance a number of Java applications allocates memory in the native area. Using java.nio.ByteBuffer or 3rd party JNI libs those applications store large, long-lived buffers that are managed with underlying system’s native I/O operations.
By default, Metaspace allocation is only limited by the amount of available native OS memory. And in combination with incorrect memory limits determination in Docker containers, this increases the risk of application instability. Limiting the size of the metadata is important, specially if you are having OOM issues. Do this with the special option -XX:MaxMetaspaceSize.
With all the objects stored outside of the normal garbage-collected heap memory, it is not obvious what impact they can have upon the memory footprint of a Java application. There is a good article that explains the issue in details and provides some guidelines how to analyze the native memory usage:
And interesting conclusions of the author:
